California roads. Public evidence.

Every road has a story.
See what the crash records reveal.

Understand where crashes happen, which patterns stand out, and what deserves a closer look in your community.

Explore California

Independent research from California’s public crash records.

From the latest California records

Time changes the picture.

Most reported crashes

3 p.m.

5,457 reported crashes during the 3 p.m. hour.

Highest serious-or-fatal share*

3 a.m.

67 of 1,091 crashes (6.1%). 1.77× the statewide share.

Aug 7, 2026 to Nov 4, 2026 · CHP CCRS

Explore the hourly pattern
How to read this comparison

Each column represents one hour. The upper chart shows reported crash counts; the lower chart shows the share involving fatal or suspected-serious injuries. Each chart has its own scale. *The highlighted serious-or-fatal hour requires at least 30 crashes and 5 serious-or-fatal crashes. The statewide comparison is 2,595 of 74,822 crashes (3.5%). These are shares of reported crashes, not the chance of a crash per trip.

Start close to home

Your community.
A clearer picture.

Look up a place to see its recurring crash types, time patterns, and how it compares with California.

Find a local story

What local evidence can reveal

Different roads.
Different safety needs.

A statewide total can hide local differences. These three areas show how nearby crash patterns compare with their surrounding county.

Jan 1 to Sep 30, 2026 · 1 km study areas · Reported crash coordinates
Illustrative areas near I-405 and SR-91; nearby streets and ramps are included.

Near I-405 · Los Angeles County

Motorcycles deserve a closer look here.

9 of 93 nearby reported crashes involved motorcycles.

Within this 1 km area9.7%
9 of 93 mapped crashes
Los Angeles County3.0%
1,562 of 52,018 mapped crashes

A question worth askingWhere along the surrounding roads do motorcycle crashes cluster?

Explore this area

Opens the public map for this area and period. Later revisions and inferred locations may change the totals.
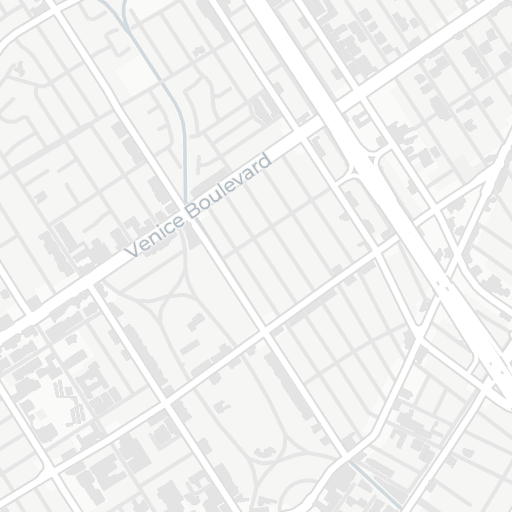
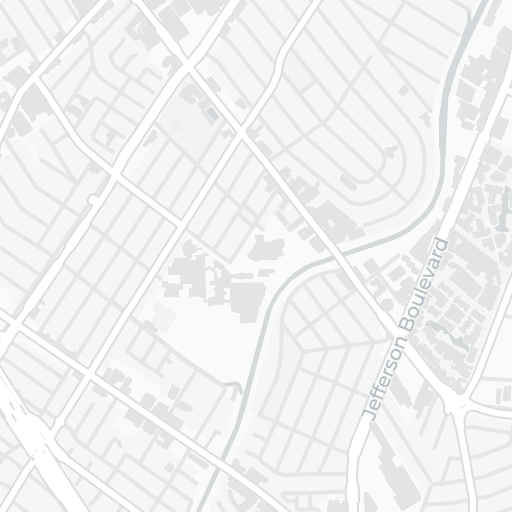
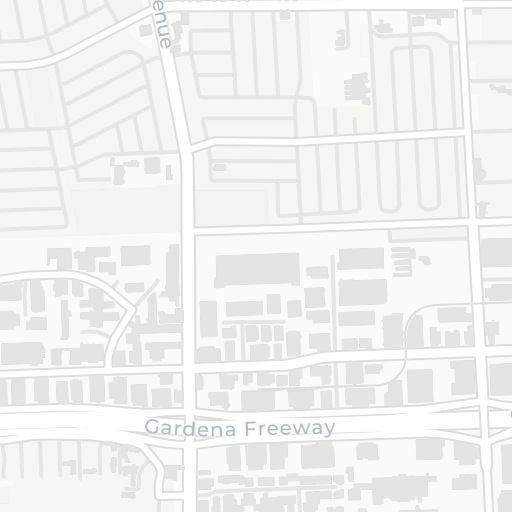
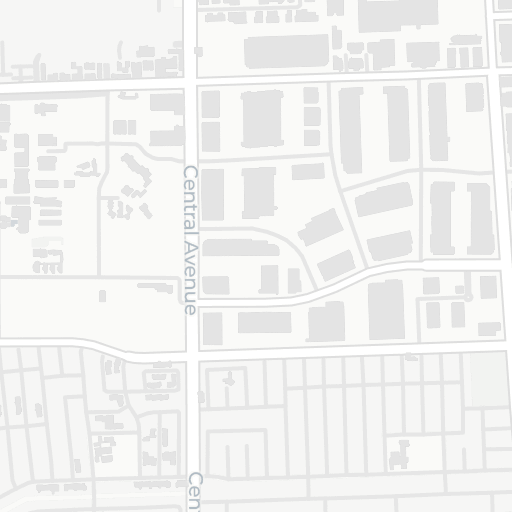
Crash locations in a 1 km radius near I-405, Los Angeles County93 reported crash locations over a labeled street map. 9 matching crashes are filled circles; other crashes are hollow circles. The dashed circle marks the 1 km study area. North is up. Overlapping locations can hide points.I-405 areaN500 m
Reported locations · 1 km radius · North upMotorcycle involvementOther reported crashes
Area, source, and limits

Jan 1, 2026 to Sep 30, 2026. Reported crash coordinates only. The study center (34.00299, -118.41130) is approximate. The circle includes nearby streets and ramps, not only I-405. Records without usable reported coordinates are excluded from both local and county comparisons.

Illustrative area selected for its contrasting pattern, not a ranking of roads or a measure of personal risk. Vehicle involvement does not establish fault.

CHP CCRS records, captured Oct 29, 2026. Categories can overlap. Geographic dots can overlap too.

Read the wider I-405 profile

Near SR-91 · Riverside County

Rear-end crashes stand out in this area.

78 of 119 nearby reported crashes were rear-end collisions.

Within this 1 km area65.5%
78 of 119 mapped crashes
Riverside County32.9%
5,181 of 15,731 mapped crashes

A question worth askingAre rear-end crashes concentrated near ramps, junctions, or other approaches?

Explore this area

Opens the public map for this area and period. Later revisions and inferred locations may change the totals.
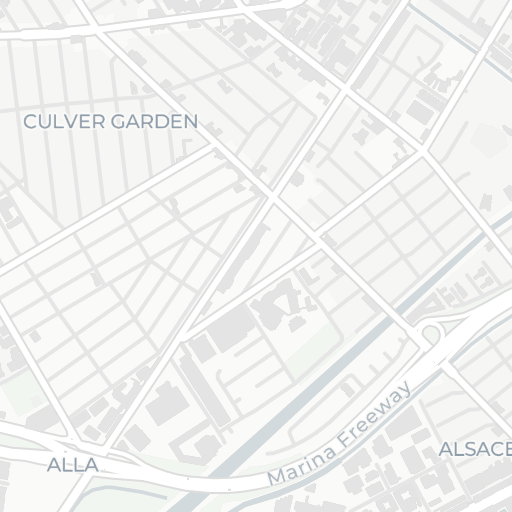
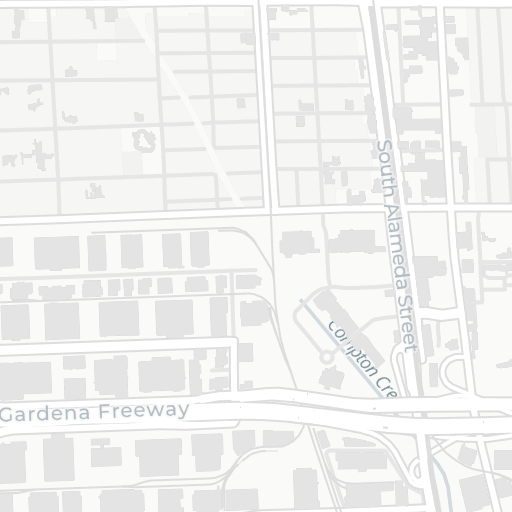
Crash locations in a 1 km radius near SR-91, Riverside County119 reported crash locations over a labeled street map. 78 matching crashes are filled circles; other crashes are hollow circles. The dashed circle marks the 1 km study area. North is up. Overlapping locations can hide points.SR-91 areaN500 m
Reported locations · 1 km radius · North upRear-end crashesOther reported crashes
Area, source, and limits

Jan 1, 2026 to Sep 30, 2026. Reported crash coordinates only. The study center (33.90341, -117.46194) is approximate. The circle includes nearby streets and ramps, not only SR-91. Records without usable reported coordinates are excluded from both local and county comparisons.

Illustrative area selected for its contrasting pattern, not a ranking of roads or a measure of personal risk. Vehicle involvement does not establish fault. Collision type is known for 119 of 119 local crashes and 15,721 of 15,731 county crashes.

CHP CCRS records, captured Oct 29, 2026. Categories can overlap. Geographic dots can overlap too.

Read the wider SR-91 profile

Near SR-91 · Los Angeles County

Large vehicles are part of the local picture.

14 of 66 nearby reported crashes were recorded as involving commercial or large vehicles.

Within this 1 km area21.2%
14 of 66 mapped crashes
Los Angeles County5.1%
2,636 of 52,018 mapped crashes

A question worth askingWhich nearby roads account for these large-vehicle crashes?

Explore this area

Opens the public map for this area and period. Later revisions and inferred locations may change the totals.
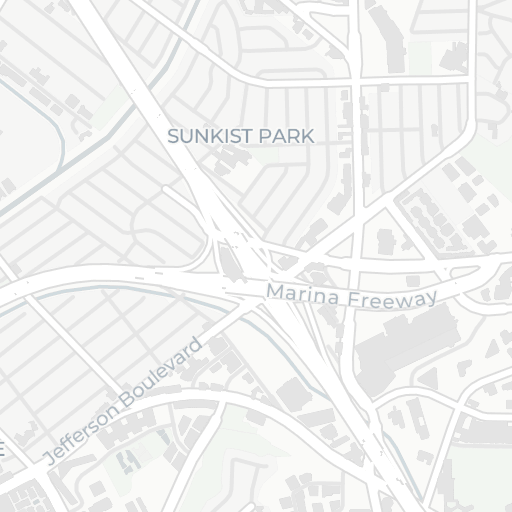
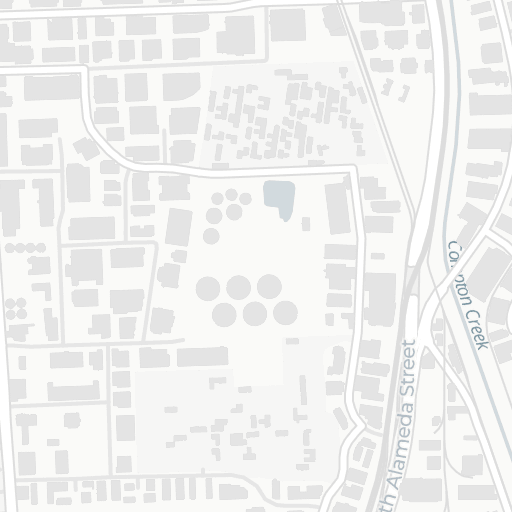
Crash locations in a 1 km radius near SR-91, Los Angeles County66 reported crash locations over a labeled street map. 14 matching crashes are filled circles; other crashes are hollow circles. The dashed circle marks the 1 km study area. North is up. Overlapping locations can hide points.SR-91 areaN500 m
Reported locations · 1 km radius · North upCommercial / large-vehicle involvementOther reported crashes
Area, source, and limits

Jan 1, 2026 to Sep 30, 2026. Reported crash coordinates only. The study center (33.87388, -118.23384) is approximate. The circle includes nearby streets and ramps, not only SR-91. Records without usable reported coordinates are excluded from both local and county comparisons.

Illustrative area selected for its contrasting pattern, not a ranking of roads or a measure of personal risk. Vehicle involvement does not establish fault. The commercial / large-vehicle category is broader than trucks.

CHP CCRS records, captured Oct 29, 2026. Categories can overlap. Geographic dots can overlap too.

Read the wider SR-91 profile

Evidence you can use

Bring a clearer question
to the conversation.

Explore a pattern, follow the records behind it, and share what you find with your neighbors, newsroom, or local transportation team.

Zero is the goal.

Evidence is how
we get there.

Evidence for Zero is independent civic research operated by Meru AI. We turn public records into readable maps and comparisons so communities can ask better questions about their roads.

Meet the project

Know what you’re looking at.

Our crash records come from the California Highway Patrol’s California Crash Reporting System. Reporting windows appear beside each finding. Records and locations may be incomplete or revised.

Counts and shares describe reported crashes. They do not establish fault or measure the chance of a crash per trip. We are not affiliated with or endorsed by CHP or any government agency.

Read sources and methodology See how we make the records more useful

Help keep this work public.

Sponsors support public maps and research. Findings, methods, and corrections remain independent.

Support the project